<dependency>
 <groupId>io.vertx</groupId>
 <artifactId>vertx-dropwizard-metrics</artifactId>
 <version>4.3.8</version>
</dependency>You are currently viewing the documentation for Vert.x 4.3.8. Visit the latest version of this page.
Metrics
This project implements the Vert.x Metrics Service Provider Interface (SPI) reporting metrics to the Dropwizard metrics library.
Features
A fairly simple API to retrieve metrics via the Measured interface which is implemented by various Vert.x components like HttpServer, NetServer, and even Vertx itself.
Configurable JMX reporting based on Dropwizard implementation, exposing Vert.x as JMX MBeans.
Getting started
To enable metrics, add the following dependency to the dependencies section of your build descriptor:
-
Maven (in your
pom.xml):
-
Gradle (in your
build.gradlefile):
compile 'io.vertx:vertx-dropwizard-metrics:4.3.8'Then when you create vertx enable metrics using the DropwizardMetricsOptions:
Vertx vertx = Vertx.vertx(new VertxOptions().setMetricsOptions(
    new DropwizardMetricsOptions().setEnabled(true)
));
You can also enable JMX:
Vertx vertx = Vertx.vertx(new VertxOptions().setMetricsOptions(
    new DropwizardMetricsOptions().setJmxEnabled(true)
));
To see details about JMX see the JMX section at the bottom.
Command line activation
When running Vert.x from the command line interface, metrics can be activated via JVM system properties. System properties beginning with vertx.metrics.options. are transmitted to the metrics options.
The vertx.metrics.options.enabled is a standard Vert.x Core option for enabling the metrics implementations, this options must be set to true:
java -jar your-fat-jar -Dvertx.metrics.options.enabled=true
The vertx.metrics.options.registryName configures the Dropwizard Registry to use:
java -jar your-fat-jar -Dvertx.metrics.options.enabled=true -Dvertx.metrics.options.registryName=my-registry
The vertx.metrics.options.jmxEnabled and vertx.metrics.options.jmxDomain configures the JMX registration:
java -jar your-fat-jar -Dvertx.metrics.options.enabled=true -Dvertx.metrics.options.jmxEnabled=true ...
The vertx.metrics.options.configPath option allows to reconfigure the metrics from a property file.
Metrics service
While Vert.x core defines an SPI for reporting metrics (implemented for instance in this project), it does not define an API for retrieving metrics (because some metrics collectors just do reporting and nothing more).
The MetricsService provides an API in front of the Dropwizard Registry to get metrics data snapshots.
Naming
Each measured component listed below (except for Vertx) will have a base name associated with it. Each metric can be retrieved by providing the fully qualified name <fqn> baseName + . + metricName from Vertx:
JsonObject metrics = metricsService.getMetricsSnapshot(vertx);
metrics.getJsonObject("vertx.eventbus.handlers");
or from the measured component itself using just the metric name:
EventBus eventBus = vertx.eventBus();
JsonObject metrics = metricsService.getMetricsSnapshot(eventBus);
metrics.getJsonObject("handlers");
See more examples below on how to retrieve/use metrics for a specific component.
Metrics names can also be listed:
Set<String> metricsNames = metricsService.metricsNames();
for (String metricsName : metricsNames) {
  System.out.println("Known metrics name " + metricsName);
}
baseName defaults to vertx, but can be set to a custom value:
DropwizardMetricsOptions metricsOptions =
  new DropwizardMetricsOptions().setBaseName("foo");
Retrieving metrics
Once enabled, the MetricsService allows to retrieve metrics snapshots from any Measured object which provides a map of the metric name to the data, represented by a JsonObject. So for example if we were to print out all metrics for a particular Vert.x instance:
MetricsService metricsService = MetricsService.create(vertx);
JsonObject metrics = metricsService.getMetricsSnapshot(vertx);
System.out.println(metrics);
For details on the actual contents of the data (the actual metric) represented by the JsonObject consult the implementation documentation like vertx-metrics |
Often it is desired that you only want to capture specific metrics for a particular component, like an http server without having to know the details of the naming scheme of every metric (something which is left to the implementers of the SPI).
Since HttpServer implements Measured, you can easily grab all metrics that are specific for that particular http server.
MetricsService metricsService = MetricsService.create(vertx);
HttpServer server = vertx.createHttpServer();
// set up server
JsonObject metrics = metricsService.getMetricsSnapshot(server);
Metrics can also be retrieved using a base name:
MetricsService metricsService = MetricsService.create(vertx);
JsonObject metrics = metricsService.getMetricsSnapshot("vertx.eventbus.message");
Data
Below is how each dropwizard metric is represented in JSON. Please refer to the Dropwizard metrics documentation for detailed information on each metric.
Gauge
{
 "type"  : "gauge",
 "value" : value // any json value
}
Counter
{
 "type"  : "counter",
 "count" : 1 // number
}
Histogram
{
 "type"   : "histogram",
 "count"  : 1 // long
 "min"    : 1 // long
 "max"    : 1 // long
 "mean"   : 1.0 // double
 "stddev" : 1.0 // double
 "median" : 1.0 // double
 "75%"    : 1.0 // double
 "95%"    : 1.0 // double
 "98%"    : 1.0 // double
 "99%"    : 1.0 // double
 "99.9%"  : 1.0 // double
}
Meter
{
 "type"              : "meter",
 "count"             : 1 // long
 "meanRate"          : 1.0 // double
 "oneMinuteRate"     : 1.0 // double
 "fiveMinuteRate"    : 1.0 // double
 "fifteenMinuteRate" : 1.0 // double
 "rate"              : "events/second" // string representing rate
}
ThroughputMeter
Extends a Meter to provide an instant throughput.
{
 "type"              : "meter",
 "count"             : 40 // long
 "meanRate"          : 2.0 // double
 "oneSecondRate"     : 3 // long - number of occurence for the last second
 "oneMinuteRate"     : 1.0 // double
 "fiveMinuteRate"    : 1.0 // double
 "fifteenMinuteRate" : 1.0 // double
 "rate"              : "events/second" // string representing rate
}
Timer
A timer is basically a combination of Histogram + Meter.
{
 "type": "timer",

 // histogram data
 "count"  : 1 // long
 "min"    : 1 // long
 "max"    : 1 // long
 "mean"   : 1.0 // double
 "stddev" : 1.0 // double
 "median" : 1.0 // double
 "75%"    : 1.0 // double
 "95%"    : 1.0 // double
 "98%"    : 1.0 // double
 "99%"    : 1.0 // double
 "99.9%"  : 1.0 // double

 // meter data
 "meanRate"          : 1.0 // double
 "oneMinuteRate"     : 1.0 // double
 "fiveMinuteRate"    : 1.0 // double
 "fifteenMinuteRate" : 1.0 // double
 "rate"              : "events/second" // string representing rate
}
Throughput Timer
Extends a Timer to provide an instant throughput metric.
{
 "type": "timer",

 // histogram data
 "count"      : 1 // long
 "min"        : 1 // long
 "max"        : 1 // long
 "mean"       : 1.0 // double
 "stddev"     : 1.0 // double
 "median"     : 1.0 // double
 "75%"        : 1.0 // double
 "95%"        : 1.0 // double
 "98%"        : 1.0 // double
 "99%"        : 1.0 // double
 "99.9%"      : 1.0 // double

 // meter data
 "meanRate"          : 1.0 // double
 "oneSecondRate"     : 3 // long - number of occurence for the last second
 "oneMinuteRate"     : 1.0 // double
 "fiveMinuteRate"    : 1.0 // double
 "fifteenMinuteRate" : 1.0 // double
 "rate"              : "events/second" // string representing rate
}
The metrics
The following metrics are currently provided.
Vert.x metrics
The following metrics are provided:
Event bus metrics
Base name: vertx.eventbus
-
handlers- A Counter of the number of event bus handlers -
handlers.myaddress- A Timer representing the rate of which messages are being processed for the myaddress handler -
messages.bytes-read- A Meter of the number of bytes read when receiving remote messages -
messages.bytes-written- A Meter of the number of bytes written when sending remote messages -
messages.pending- A Counter of the number of messages received but not yet processed by an handler -
messages.pending-local- A Counter of the number of messages locally received but not yet processed by an handler -
messages.pending-remote- A Counter of the number of messages remotely received but not yet processed by an handler -
messages.discarded- A Counter of the number of messages discarded by an handler -
messages.discarded-local- A Counter of the number of messages locally discarded by an handler -
messages.discarded-remote- A Counter of the number of messages remotely discarded by an handler -
messages.received- A ThroughputMeter representing the rate of which messages are being received -
messages.received-local- A ThroughputMeter representing the rate of which local messages are being received -
messages.received-remote- A ThroughputMeter representing the rate of which remote messages are being received -
messages.delivered- A ThroughputMeter representing the rate of which messages are being delivered to an handler -
messages.delivered-local- A ThroughputMeter representing the rate of which local messages are being delivered to an handler -
messages.delivered-remote- A ThroughputMeter representing the rate of which remote messages are being delivered to an handler -
messages.sent- A [throughput_metert] representing the rate of which messages are being sent -
messages.sent-local- A ThroughputMeter representing the rate of which messages are being sent locally -
messages.sent-remote- A ThroughputMeter representing the rate of which messages are being sent remotely -
messages.published- A ThroughputMeter representing the rate of which messages are being published -
messages.published-local- A ThroughputMeter representing the rate of which messages are being published locally -
messages.published-remote- A ThroughputMeter representing the rate of which messages are being published remotely -
messages.reply-failures- A Meter representing the rate of reply failures
The monitored event bus handlers is configurable via a match performed on the handler registration address. Vert.x can have potentially a huge amount of registered event bus, therefore the only good default for this setting is to monitor zero handlers.
The monitored handlers can be configured in the DropwizardMetricsOptions via a specific address match or a regex match:
Vertx vertx = Vertx.vertx(new VertxOptions().setMetricsOptions(
    new DropwizardMetricsOptions().
        setEnabled(true).
        addMonitoredEventBusHandler(
            new Match().setValue("some-address")).
        addMonitoredEventBusHandler(
            new Match().setValue("business-.*").setType(MatchType.REGEX))
));| if you use regex match, a wrong regex can potentially match a lot of handlers. |
Http server metrics
Base name: vertx.http.servers.<host>:<port>
Http server includes all the metrics of a Net Server plus the following:
-
requests- A Throughput Timer of a request and the rate of it’s occurrence -
<http-method>-requests- A Throughput Timer of a specific http method request and the rate of it’s occurrence-
Examples:
get-requests,post-requests
-
-
<http-method>-requests./<uri>- A Throughput Timer of a specific http method & URI request and the rate of it’s occurrence-
Examples:
get-requests./some/uri,post-requests./some/uri?foo=bar
-
-
<http-method>-requests./<route>- A Throughput Timer of a specific http method & request route and the rate of it’s occurrence-
Examples:
get-requests./route1,post-requests./resource/:id
-
-
responses-1xx- A ThroughputMeter of the 1xx response code -
responses-2xx- A ThroughputMeter of the 2xx response code -
responses-3xx- A ThroughputMeter of the 3xx response code -
responses-4xx- A ThroughputMeter of the 4xx response code -
responses-5xx- A ThroughputMeter of the 5xx response code -
open-websockets- A Counter of the number of open web socket connections -
open-websockets.<remote-host>- A Counter of the number of open web socket connections for a particular remote host
Http URI metrics must be explicitly configured in the options either by exact match or regex match:
Vertx vertx = Vertx.vertx(new VertxOptions().setMetricsOptions(
    new DropwizardMetricsOptions().
        setEnabled(true).
        addMonitoredHttpServerUri(
            new Match().setValue("/")).
        addMonitoredHttpServerUri(
            new Match().setValue("/foo/.*").setType(MatchType.REGEX))
));
In case if the uri contains some path parameters like /users/:userId it might not make sense to have a separate entry in the registry for each user id (like get-requests./users/1, get-requests./users/2 and so on) but a summarized one. To achieve that you can set an alias to the match instance in this case the alias will be used as a part of the registry name instead of uri like <http-method>-requests.<alias>. In addition there will be separate counters for each response group for each defined alias like responses-<code>.<alias>.
Vertx vertx = Vertx.vertx(new VertxOptions().setMetricsOptions(
    new DropwizardMetricsOptions().
        setEnabled(true).
        addMonitoredHttpServerUri(new Match().setValue("/users/.*").setAlias("users").setType(MatchType.REGEX))
));
Http request routes can be reported by frameworks like vertx-web per request, i.e. core vert.x doesn’t report any route information by itself. Like URI metrics, route metrics must be configured explicitly in the options:
Vertx vertx = Vertx.vertx(new VertxOptions().setMetricsOptions(
  new DropwizardMetricsOptions().
    setEnabled(true).
    addMonitoredHttpServerRoute(new Match().setValue("/users/.*").setType(MatchType.REGEX))
));
Similar to URI metrics it is possible to provide aliases but usually routes itself provide sufficient and appropriate semantic grouping of URIs. Note that a single http request can be routed multiple times (for example because of vertx-web sub routers) and all reported routes per request will be joined together with > (for example /internal_api>/resource/:id)
For bytes-read and bytes-written the bytes represent the body of the request/response, so headers, etc are ignored.
Http client metrics
Base name: vertx.http.clients (by default) or vertx.http.clients.<id> where <id> is a non empty string configured by setMetricsName.
Http client includes all the metrics of a Http Server plus the following:
-
connections.max-pool-size- A Gauge of the max connection pool size -
connections.pool-ratio- A ratio Gauge of the open connections / max connection pool size -
responses-1xx- A Meter of the 1xx response code -
responses-2xx- A Meter of the 2xx response code -
responses-3xx- A Meter of the 3xx response code -
responses-4xx- A Meter of the 4xx response code -
responses-5xx- A Meter of the 5xx response code
The http client manages a pool of connection for each remote endpoint with a queue of pending requests
Endpoint metrics are available too:
-
endpoint.<host:port>.queue-delay- A Timer of the wait time of a pending request in the queue -
endpoint.<host:port>.queue-size- A Counter of the actual queue size -
endpoint.<host:port>.open-netsockets- A Counter of the actual number of open sockets to the endpoint -
endpoint.<host:port>.usage- A Timer of the delay between the request starts and the response ends -
endpoint.<host:port>.in-use- A Counter of the actual number of request/response -
endpoint.<host:port>.ttfb- A Timer of the wait time between the request ended and its response begins
where <host> is the endpoint host name possibly unresolved and <port> the TCP port.
The monitored endpoints are configurable via a match performed on the server $host:$port. The default for this setting is to monitor no endpoints.
The monitored endpoints can be configured in the DropwizardMetricsOptions via a specific hostname match or a regex match:
Vertx vertx = Vertx.vertx(new VertxOptions().setMetricsOptions(
    new DropwizardMetricsOptions().
        setEnabled(true).
        addMonitoredHttpClientEndpoint(
            new Match().setValue("some-host:80")).
        addMonitoredHttpClientEndpoint(
            new Match().setValue("another-host:.*").setType(MatchType.REGEX))
));
Net server metrics
Base name: vertx.net.servers.<host>:<port>
-
open-netsockets- A Counter of the number of open net socket connections -
open-netsockets.<remote-host>- A Counter of the number of open net socket connections for a particular remote host -
connections- A Timer of a connection and the rate of it’s occurrence -
exceptions- A Counter of the number of exceptions -
bytes-read- A Counter of the number of bytes read. -
bytes-written- A Counter of the number of bytes written.
Net client metrics
Base name: vertx.net.clients (by default) or vertx.net.clients.<id> where <id> is a non empty string configured by setMetricsName.
Net client includes all the metrics of a Net Server
Client metrics
Base name: vertx.<type>.clients (by default) or vertx.<type>.clients.<id> where <id> is an identifier for client metrics and <type> is the type of metrics.
The type for SQL client is sql and the identifier is the metricsName defined by the client options.
Client includes the following:
-
endpoint.<host:port>.requests- A Timer of the requests latencies -
endpoint.<host:port>.queue-delay- A Timer of the wait time of a pending request in the queue -
endpoint.<host:port>.queue-size- A Counter of the actual queue size -
endpoint.<host:port>.in-use- A Counter of the actual number of request/response -
endpoint.<host:port>.ttfb- A Timer of the wait time between the request ended and its response begins
Datagram socket metrics
Base name: vertx.datagram
Pool metrics
Base name: vertx.pools.<type>.<name> where type is the type of the pool (e.g worker, datasource) and name is the name of the pool (e.g vert.x-worker-thread).
Pools of type worker are blocking worker pools. Vert.x exposes its worker as vert.x-worker-thread and vert.x-internal-blocking. Named worker executor created with WorkerExecutor are exposed.
Datasource created with Vert.x JDBC clients are exposed as datasource.
-
queue-delay- A Timer measuring the duration of the delay to obtain the resource, i.e the wait time in the queue -
queue-size- A Counter of the actual number of waiters in the queue -
usage- A Timer measuring the duration of the usage of the resource -
in-use- A [count] of the actual number of resources used -
pool-ratio- A ratio Gauge of the in use resource / pool size -
max-pool-size- A Gauge of the max pool size
The pool-ratio and the max_pool_size won’t be present when the measured pool’s max pool size could not be determined.
JMX
JMX is disabled by default.
If you want JMX, then you need to enabled that:
Vertx vertx = Vertx.vertx(new VertxOptions().setMetricsOptions(
    new DropwizardMetricsOptions().setJmxEnabled(true)
));
If running Vert.x from the command line you can enable metrics and JMX by uncommented the JMX_OPTS line in the vertx or vertx.bat script:
JMX_OPTS="-Dcom.sun.management.jmxremote -Dvertx.metrics.options.jmxEnabled=true"
You can configure the domain under which the MBeans will be created:
Vertx vertx = Vertx.vertx(new VertxOptions().setMetricsOptions(
    new DropwizardMetricsOptions().
        setJmxEnabled(true).
        setJmxDomain("mydomain")
));
In the command line, just append the following system properties to your application (works for the vertx cli and fat jars):
-Dvertx.metrics.options.jmxEnabled=true -Dvertx.metrics.options.jmxDomain=vertxEnabling remote JMX
If you want the metrics to be exposed remotely over JMX, then you need to set, at minimum the following system property:
com.sun.management.jmxremote
If running from the command line this can be done by editing the vertx or vertx.bat and uncommenting the JMX_OPTS line.
Please see the Oracle JMX documentation for more information on configuring JMX
If running Vert.x on a public server please be careful about exposing remote JMX access
Accessing Dropwizard Registry
When configuring the metrics service, an optional registry name can be specified for registering the underlying Dropwizard Registry in the the Dropwizard Shared Registry so you can retrieve this registry and use according to your needs.
VertxOptions options = new VertxOptions().setMetricsOptions(
    new DropwizardMetricsOptions().setEnabled(true).setRegistryName("my-registry")
);
Vertx vertx = Vertx.vertx(options);
// Get the registry
MetricRegistry registry = SharedMetricRegistries.getOrCreate("my-registry");}
Using already existing Dropwizard Registry
Optionally, it is possible to utilize already existing Dropwizard Registry. In order to do so pass MetricRegistry instance as parameter for setMetricRegistry function in VertxOptions object.
MetricRegistry metricRegistry = new MetricRegistry();
VertxOptions options = new VertxOptions().setMetricsOptions(
   new DropwizardMetricsOptions().setEnabled(true).setMetricRegistry(metricRegistry)
);
Vertx vertx = Vertx.vertx(options);
Using Jolokia and Hawtio
Jolokia is a JMX-HTTP bridge giving an alternative to JSR-160 connectors. It is an agent based approach with support for many platforms. In addition to basic JMX operations it enhances JMX remoting with features like bulk requests.
Hawtio is a modular web console consuming the data exposed by Jolokia. It lets you create dashboards and retrieve data from JMX such as memory, cpu, or any vert.x metrics.
This section explains how to configure your vert.x application to retrieve the metrics in Hawtio.
First, you need to configure your vert.x instance with the following options:
Vertx vertx = Vertx.vertx(new VertxOptions().setMetricsOptions(
    new DropwizardMetricsOptions()
        .setEnabled(true)
        .setJmxEnabled(true)
        .setJmxDomain("vertx-metrics")));
You can change the domain to whatever you want. The same configuration can be used for clustered Vert.x instances. This configuration instructs vertx-dropwizard-metrics to expose the metrics in the local MBean server, so Jolokia can retrieve them.
Then you need, to plug jolokia to expose the data. There are several ways to plug jolokia. See for further details. Here, we explain how to use the Jolokia agent with the default configuration. Refer to the the jolokia documentation to configure it.
The agent can either be attached when you start the application or attached on a running JVM (you would need special permission to access the process). In the first case, launch you application using:
java -javaagent:/.../agents/jolokia-jvm.jar=port=7777,host=localhost -jar ...The -javaagent specifies the path to the jolokia agent jar file. You can configure the port and host from the command line. Here it registers the REST endpoint on http://localhost:7777.
You can also attach the agent on a running JVM with:
java -jar jolokia-jvm.jar start PIDReplace PID with the process id of the JVM.
Once Jolokia is configured and launched, you can consume the data from Hawtio.
On Hawtio, enter the connection details as follows:
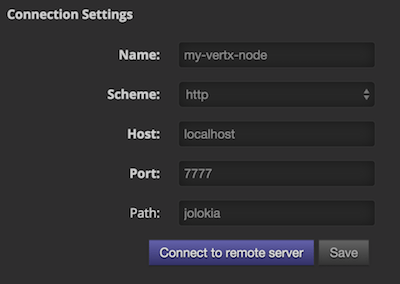
Then, you can go to the JMX tab and you should find a directory with the name you entered as JMX domain in the Vert.x configuration:
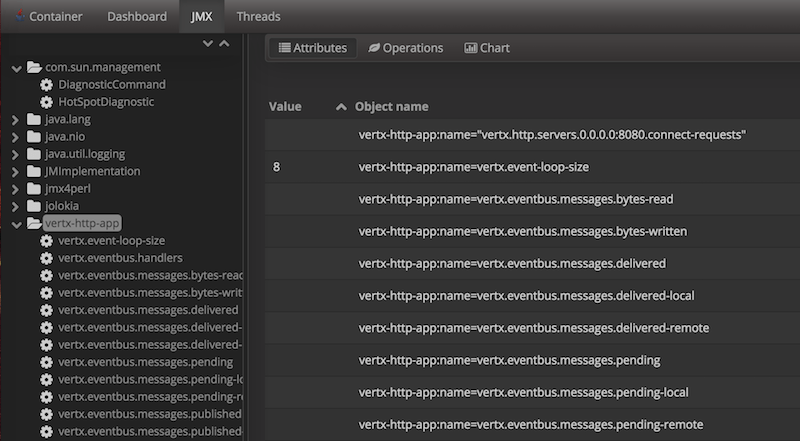
From this, you can configure your dashboard and retrieve any metric exposed by vert.x.
Using Jolokia and JMX4Perl to expose metrics to Nagios
Check_jmx4perl is a Nagios plugin using jmx4perl for accessing JMX data remotely. It lets you expose the Vert.x metrics to Nagios.
First you need to start your application with the Jolokia JVM agent attached to it. There are several ways to attach jolokia. See for further details. Here, we explain how to use the Jolokia agent with the default configuration. Refer to the the jolokia documentation to configure it.
The agent can either be attached when you start the application or attached on a running JVM (you would need special permission to access the process). In the first case, launch you application using:
java -javaagent:/.../agents/jolokia-jvm.jar=port=7777,host=localhost -jar ...The -javaagent specifies the path to the jolokia agent jar file. You can configure the port and host from the command line. Here it registers the REST endpoint on http://localhost:7777.
You can also attach the agent on a running JVM with:
java -jar jolokia-jvm.jar start PIDReplace PID with the process id of the JVM.
Once Jolokia is started, you can configure your Nagios check such as:
check_jmx4perl --url http://10.0.2.2:8778/jolokia --name eventloops --mbean vertx:name=vertx.event-loop-size
--attribute Value --warning 4
Check check_jmx4perl documentation to get more details about check configuration.
Metrics commands via Telnet or SSH in Vert.x Shell service
To find out the available metrics commands you can use the help builtin command:
-
Available commands
-
metrics-ls: List the known metrics for the current Vert.x instance
-
metrics-info: Show metrics info for the current Vert.x instance in JSON format
-
metrics-histogram: Show histogram metrics table for the current Vert.x instance in real time
-